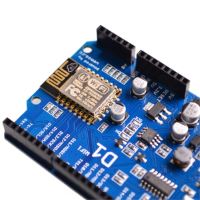
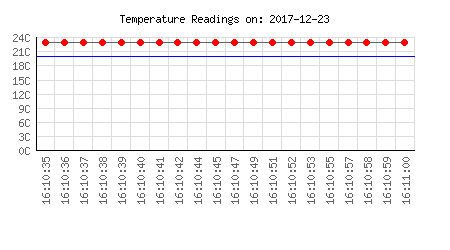
 Below is the dynamic data plot from the temperature logger in my workshop. The temperature logger uses a low cost Chinese sourced esp8266 D1 board and measures temperature and humidity every 5 seconds using a DHT11 sensor. Readings are sent to this site’s web server and stored in a MySQL database. The last 20 stored readings are graphed dynamically on this page and the blue horizontal line is set at 20oC. This post is set to auto refresh so that the most recent 20 data points are plotted every 5 minutes.
I have used a combination of easy to get off-the-self hardware devices, third party open source libraries, and some custom PHP coding to get this all working. The graph above uses a great open source lightweight PHP-based graphing library called PHPGraphLib by Elliott Brueggeman.

This whole IoT demonstrator project will be described in a series of published blog posts as one of my more advanced projects. If the temperature falls below the blue line, it is too cold to work on projects.
